
OncoNest
The First Multi-Vendor and Fully Translational AI Digital Pathology Image Analysis and AI Method for the Quantification of Tumoral Tissues where Collagen Phenotype(s) matters
USINg oncoNEST, PHARMANEST provideS FULLY AUTOMATED FIBROSIS and Associated features QUANTIFICATION services FROM DIGITAL IMAGES OF STAINED SLIDES FOR clinical and pre-clinical pharmaceutical DRUG development PROJECTS
OncoNest is a Research Only Use product for now and can be used for pre-clinical projects, for research clinical projects or as an exploratory outcome

TUMOR BURDEN AND RELATED FIBROSIS PHENOTYPE
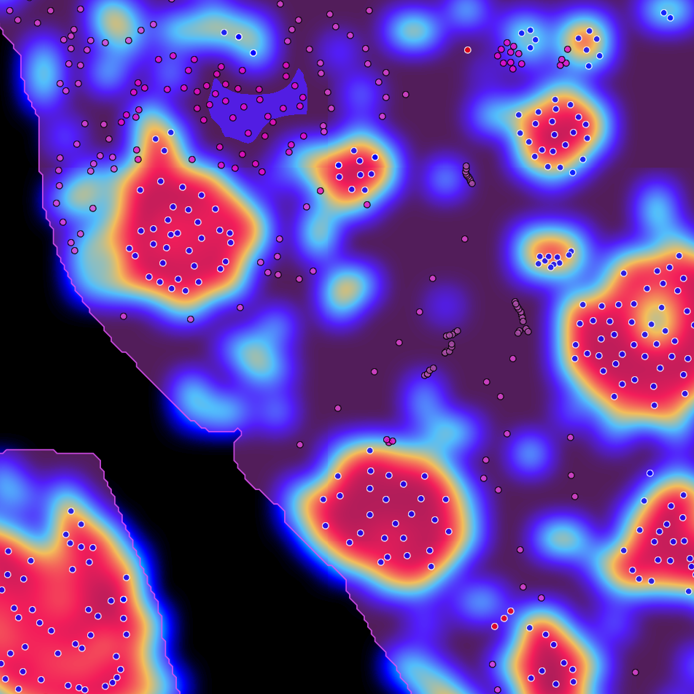
OncoNest quantifies tumor burden and the phenotype of fibrosis inside and around tumors from digital images of conventional Fibrosis-stained tissues
( 20X Picro Sirius Red in the image)
DUAL-STAINING AND T-CELL PERCOLATION
OncoNest resolves and quantify digital images of dual-stained images (for instance Masson Trichrome and IHC-CD8 as shown below) to quantify the co-localization and percolation of T-Cell across the fibrosis network in the peri and intra tumoral regions


FIBROSIS PHENOTYPIC APPLICATIONS TO CANCER CLASSIFICATION AND STAGING
OncoNest calculates composite histology-based phenotypic scores that can be used to classify and/or stage cancerous tissues from conventional histology slides.
For instance, HCC+ vs HCC- in F4 Liver Transplant Patients (1)

TUMOR IDENTIFICATION
(Machine Learning)

PERI | INTRA TUMORAL PHENOTYPING
(e.g. Fibro-immuno oncology)

TUMOR QUANTIFICATION
(Composite Continuous Scores)

CUSTOM IMAGING ASSAYS
(Machine Learning)
DESMOPLASTIC REACTION
(Intra-Tumoral Fibrosis Quantification)

(1) Automated Fibrosis Phenotyping of NASH non-tumorous lesions Digital Images Helps Classify HCC and non-HCC NASH patients who underwent liver transplantation. Hisamitsu Miyaaki1, Yuko Akazawa1 , Li Chen2, Mathieu Petitjean2 (1) Nagasaki University, Nagasaki, Japan (2) PharmaNest, Princeton, NJ, USA. AASLD 2020 (Poster here)